Data tables
Select an item under Model Build or Output Specification to open its table above the map. Edit its cells in Data Tables. Where the table allows multiple rows, select Add Row to create another entry.
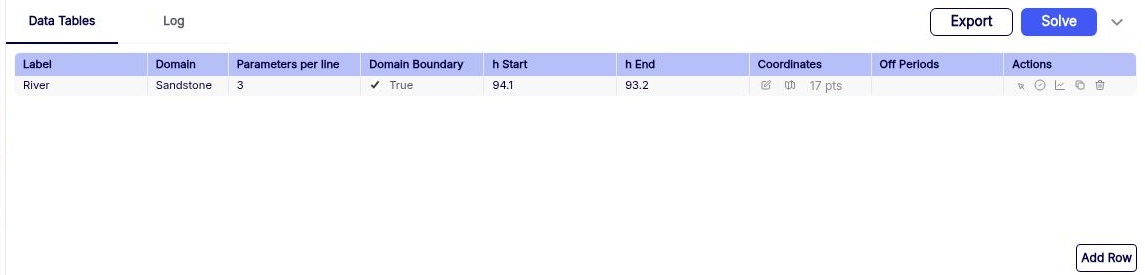
Row actions
The Actions column shows the controls available for that row. The plot controls depend on the element type and the results available.
| Symbol | What it does |
|---|---|
 Select on map |
Selects the feature in the map window. Double-click the symbol to zoom to the feature. |
 Plot check |
Opens the graph panel in Check mode for that boundary, where check results are available. |
 Plot results |
Opens the graph panel in Results mode for that row. |
 Duplicate |
Copies the row so you can edit a similar input separately. |
 Delete |
Removes the row. |
For a feature with a Coordinates cell, use the controls in that cell to edit its coordinates or work with its geometry on the map. See Edit features on the map for dragging editable features.
Use the  down chevron at the right of the top toolbar to collapse the table and give the map more room.