Map
Use the map to view model features, edit their geometry, and inspect solved results. The toolbar sits immediately above the map.
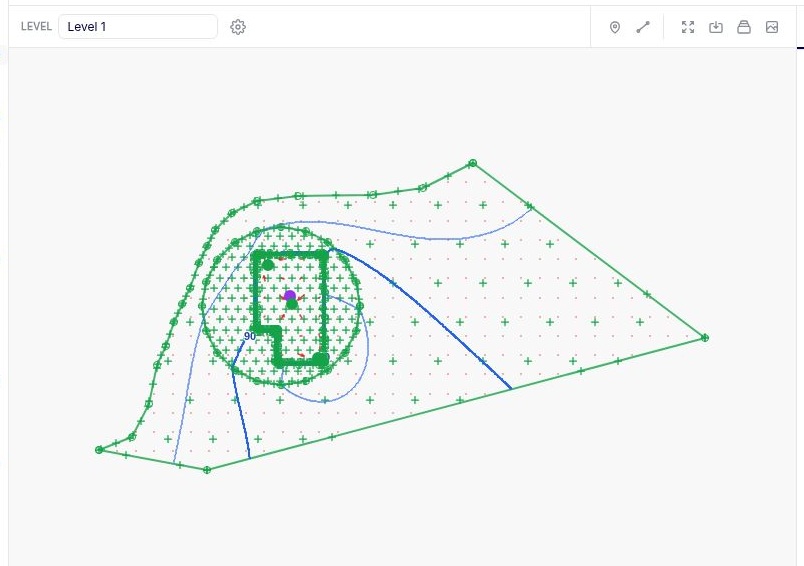
Map toolbar
| Control | What it does |
|---|---|
| Level | Choose a level to display its model inputs and results. The all-levels option shows model inputs across every level. Results require a single level. |
 Display settings |
Chooses visible layers and configures background mapping, GIS data, contours, vectors, and pathlines. |
 Probe point hydrograph |
Select the tool and click a point on the solved map to open its hydrograph in the graph panel. To use the same location in repeated solves, add a Hydrograph Point under Output Specification. |
 Probe line conditions |
Select the tool and draw a line on the solved map to open its results in the graph panel. To reuse the same line in repeated solves, add Conditions along a Line under Output Specification. |
 View full extents |
Fits the map to the model extent. |
 Save current view |
Saves the current extent and zoom as a named view. |
 Saved views |
Opens the list of saved views. Select a view to return to it. |
 Save map image |
Saves the current map view as a PNG. |
To read results at the cursor for the currently displayed level and time step, turn on Sample in the Data Panel.
Saved views
Zoom to the area you want to revisit, then select Save current view, enter a View name, and select Save. Open Saved views to load it again. If the browser window has changed size, the visible extent can differ slightly from the one you saved.
Anaqsim regenerates contours and vectors for each saved view at a resolution based on that view’s zoom. This gives a zoomed-in area more detail. Save only the views you need for reporting or review, as extra views increase output processing time.
Edit features on the map
- Click an editable model feature to select it. It turns black to show it can be dragged.
- Click and drag the selected point or an editable vertex to its new position. Release to place it.
- Check the coordinates in the data table. Solve the model again to update the results after editing its geometry.
Plot results for a feature
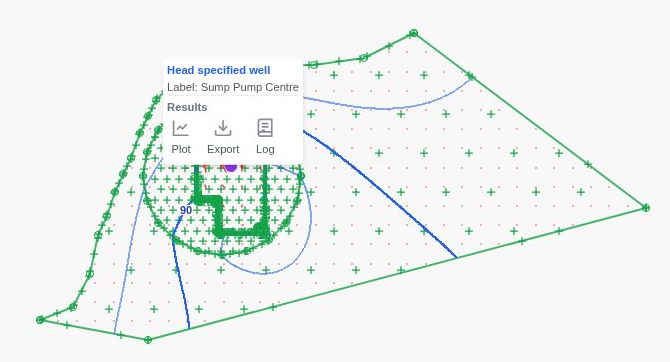
After solving, right-click a feature with available results. Choose an action under Results in the context menu.
- Plot opens the graph panel with the feature selected.
- Export downloads the feature’s results as a
.csvfile. - Log writes the feature’s results to the log file.