Graph panel
After solving, right-click a feature on the map and choose Plot under Results. You can also use  Plot results or
 Plot check in the data table’s Actions column.
This opens the graph panel, where you can view the selected results and choose results from other model elements.
Choose what to display
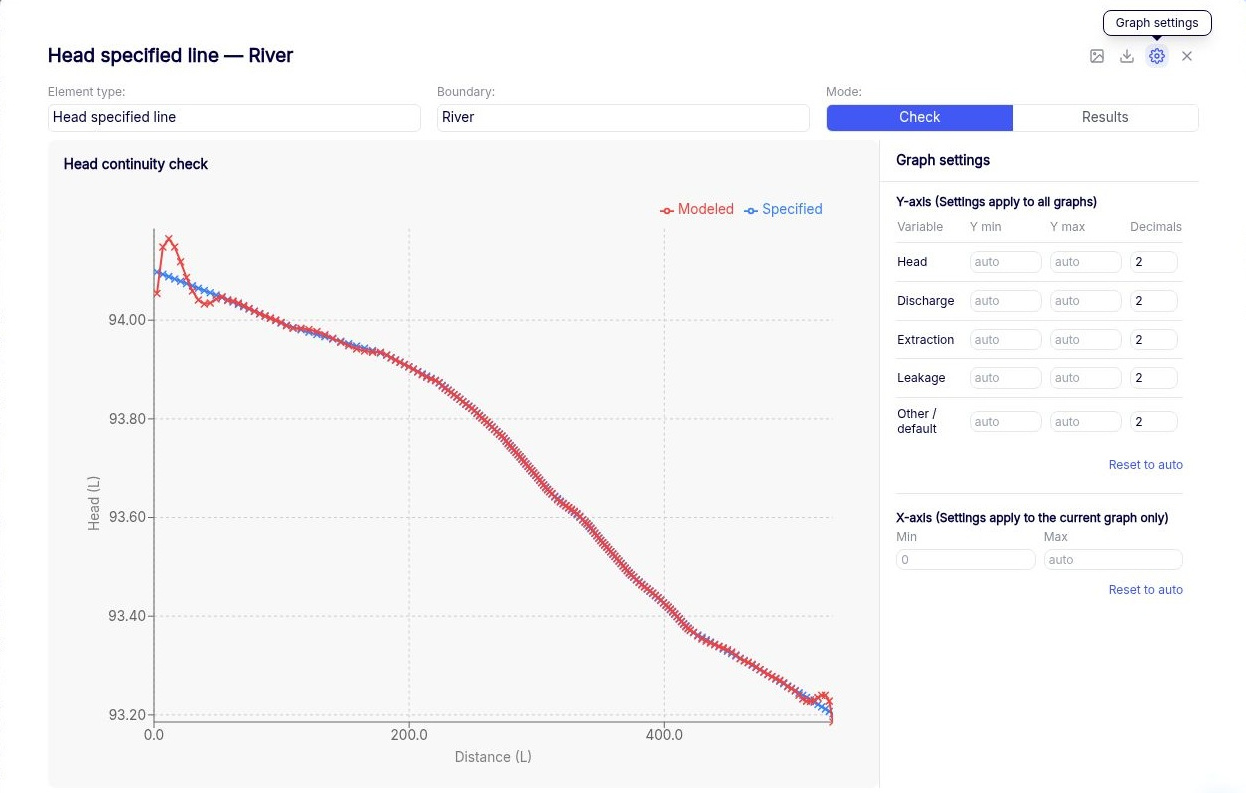
Use Element type and Boundary to inspect other features without closing the panel. Use Mode to choose what to display.
- Check helps you assess how accurately the solution approximates the specified boundary conditions along a line boundary. The graph shows the conditions along the selected boundary, with the quantities plotted depending on the boundary type.
- Results shows the calculated output for the selected feature. Some steady-state outputs show a single value.
Adjust the graph
Select Graph settings to change the axis limits and display precision. Y-axis limits and decimal places are set by variable and apply across graphs. X-axis limits apply to the current graph. Use Reset to auto to restore automatic limits for the corresponding axis.
Export an individual result
Select Export CSV in the graph panel to download the values for the current selection. Use Save image when enabled to save the graph as an image. To download several categories of model output together, use Export in the main toolbar.