Results and analysis
After you solve a model, start with the Log for solver errors and boundary conditions that missed their tolerances. If you change the model inputs, solve again before interpreting the results.
On the map
| To answer this question | Use |
|---|---|
| How do head and flow vary across the model? | Contours and vectors in Display settings. Select the model level and, for a transient run, the time step you want to inspect. |
| Where does groundwater travel, and how long does it take? | Set the starting locations under Pathlines. Use Pathline Settings for travel-time markers and capture options. |
| What is the solved value here? | Turn on Sample and move the cursor over the location you want to inspect. |
Check a solve
Check a line boundary
- Right-click the line boundary in the map window and choose Check, or select
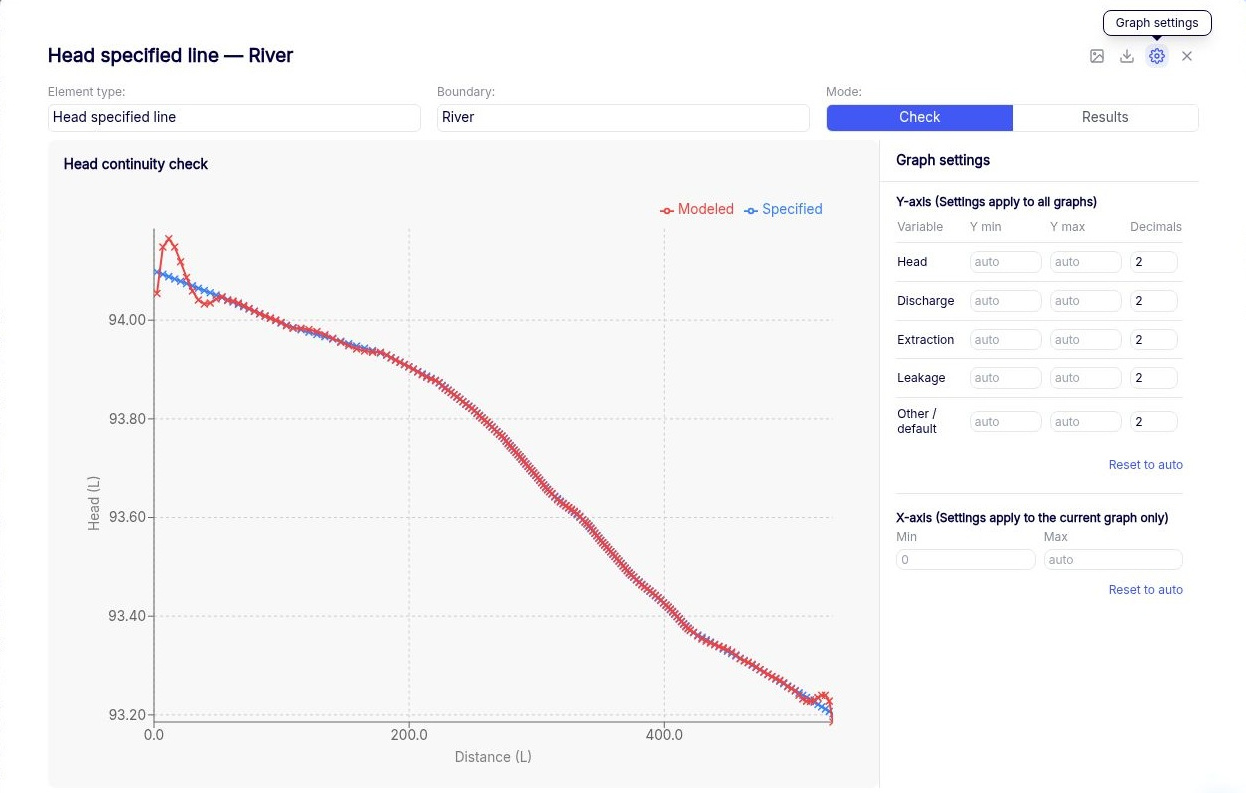
 Plot check in the data table. The Graph panel shows how closely the solution meets the boundary condition. For example, a head-specified boundary shows specified and modeled heads, and an inter-domain boundary can show the discharge on each side.
- Look for differences between the curves, especially between control points and near the ends of segments. The solver enforces the condition within the applicable tolerance at the control points and approximates it between them.
- If the curves diverge between control points, try increasing Parameters per Line in the line boundary table or dividing a long segment into shorter ones. Both add equations. Re-solve and compare the curves again.
Under Model Build → General Settings → Check Settings, review the tolerance for the quantity being checked. Use Head Check Tolerance for head, Qn Check Tolerance for river discharge per unit length, and Q Check Tolerance for the total discharge across a segment of a normal-flux or inter-domain boundary. Set tolerances in your model units. If the solver reaches its iteration limit, check the Log for conditions that missed their tolerances at control points.
Check spatially variable extraction
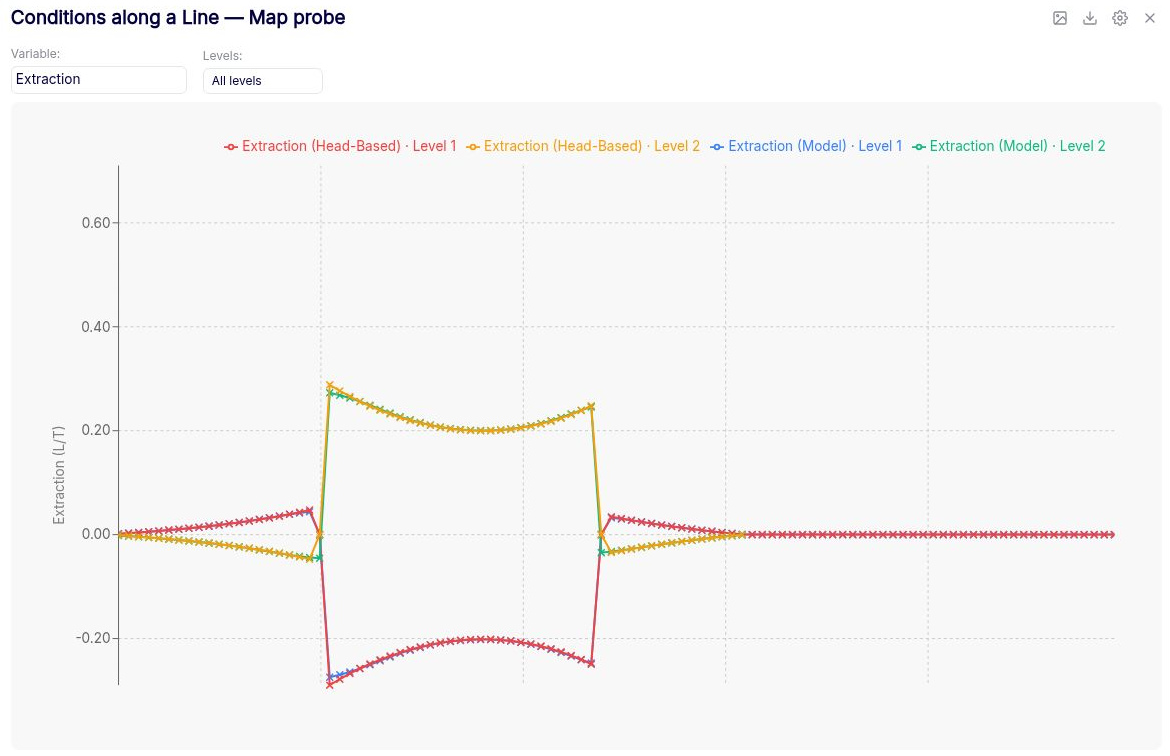
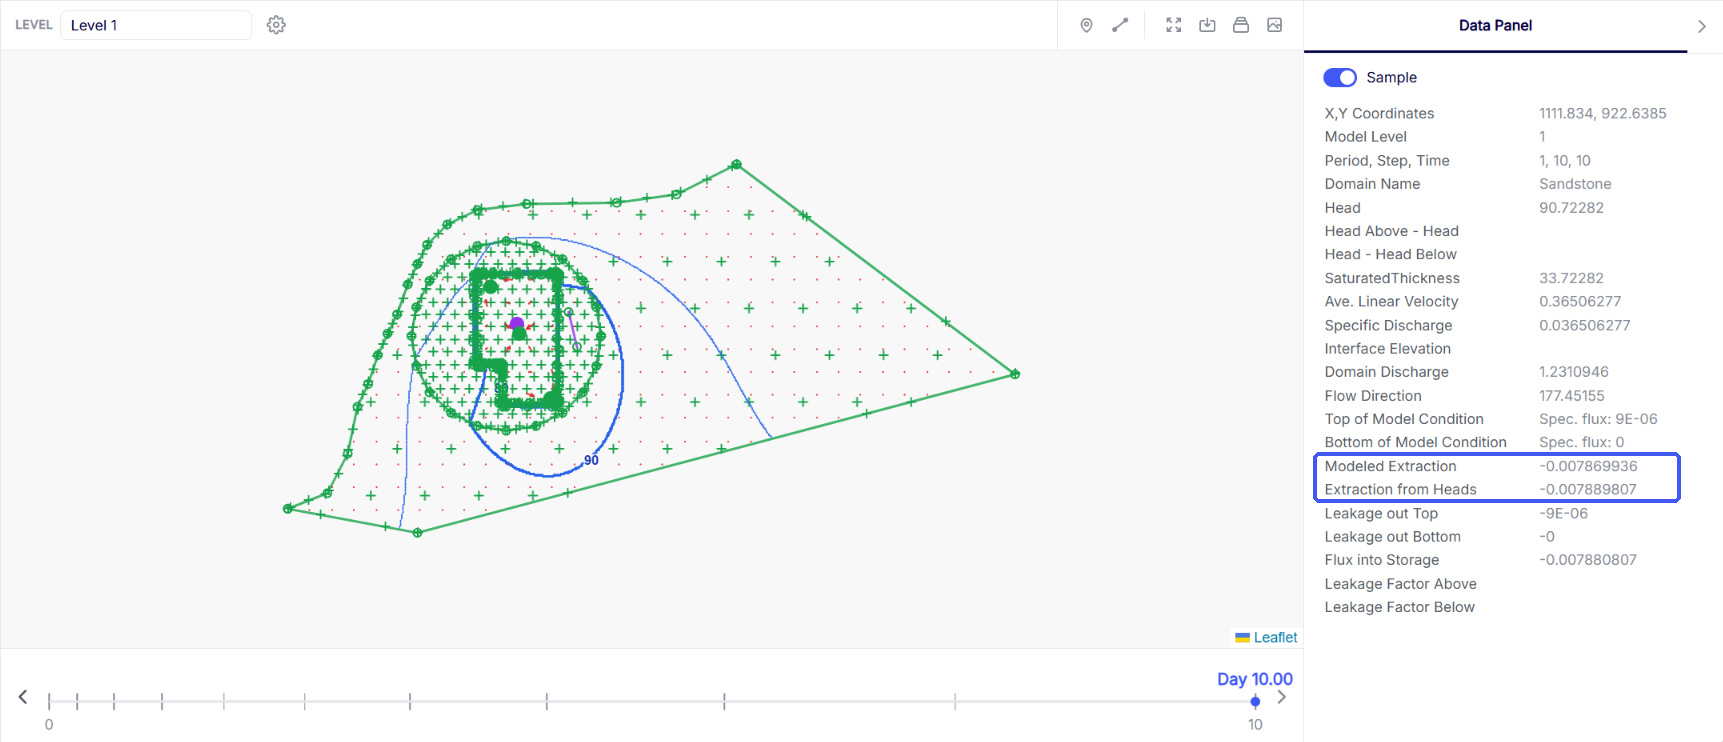
Use the line probe on a solved model, or define a repeatable transect under Output Specification → Conditions along a Line before solving. Choose Extraction to compare modeled extraction with extraction computed from heads along the line. To compare the values at one location, turn on Sample in the Data Panel and look for Modeled Extraction and Extraction from Heads.
- Modeled Extraction is the extraction per unit area represented by the spatially variable area sink.
- Extraction from Heads is the extraction per unit area calculated from the solved heads, accounting for vertical leakage and, in a transient model, changes in storage.
The solver matches the two values at the basis points within the Extraction Check Tolerance. Use the graph to see where they diverge between basis points. If the difference is too large for your analysis, reduce Spacing in the relevant spatially variable area sink, then re-solve and repeat the check. Smaller spacing places basis points closer together and adds equations.
Results for a feature
To view results for a feature, such as the discharge of a head-specified well or river reach, right-click the feature in the map window and choose Plot under Results. You can also select  Plot results in the data table’s Actions column. When you right-click the feature, Export under Results downloads a CSV and Log writes the values to the log file.
Along a line, through time, and over an area
| To answer this question | Use |
|---|---|
| How does head change through time at a location? | Set up Hydrograph points before solving, or use the point probe for a location you choose after the solve. |
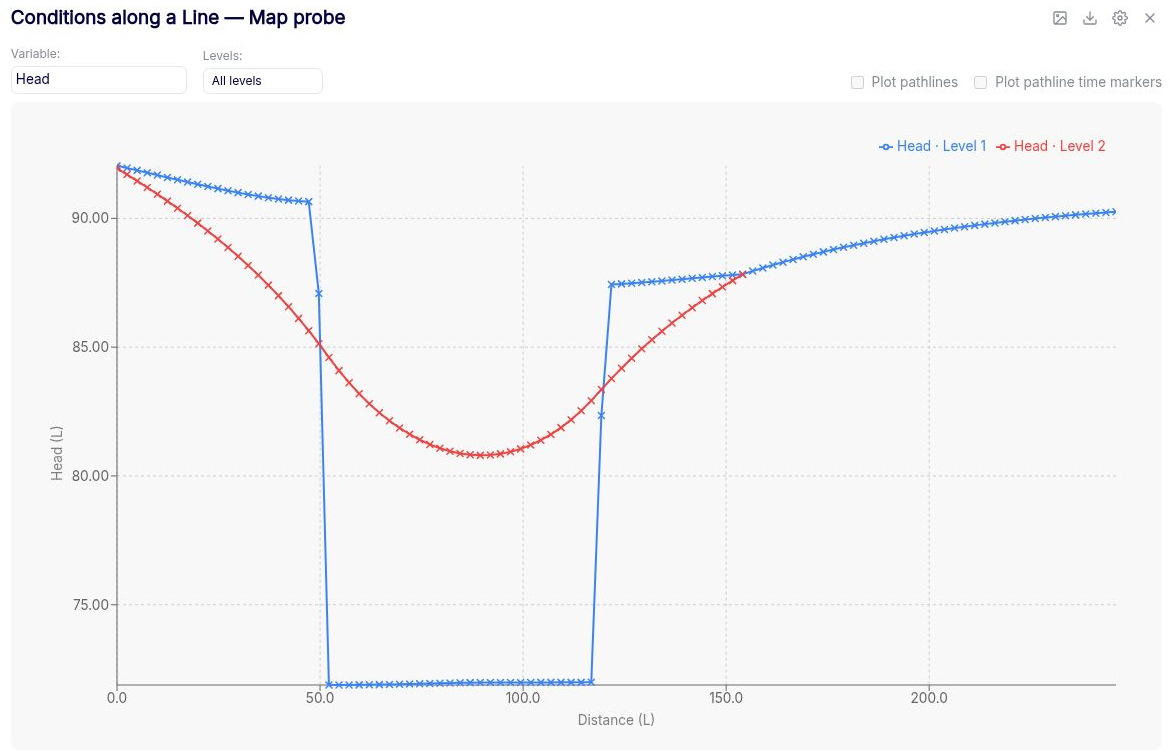
| How does head vary along a transect? | Set up Conditions along a line before solving, or use the line probe. Choose Head and set Levels to All levels to display the head profiles together. |
| How does discharge vary along a transect? | In the line graph, choose Discharge Normal for the component across the transect or Discharge Tangent for the component along it. The graph reports values at points along the transect. |
| How much vertical leakage occurs over an area? | Set up Leakage over polygons before solving. |
| How closely do model results match observations? | Set up Calibration targets for the quantities you want to compare. |
Take results into another tool
Use Export for tabular, GIS, or gridded results. For a single feature, use Export CSV in the Graph panel.